Online lighting retailer

Google Ads Case Study

70% more revenue from 11% less ad spend


This online lighting retailer now earns $9.16 in tracked sales for every $1 spent on Google Ads, almost double the $4.78 it earned a year earlier.

At a glance (Apr–Sep 2025 vs Apr–Sep 2026)

$1.47 million

in tracked Google Ads revenue, up 70%

11%

less ad spend

ROAS

up from 4.8x to 9.2x


The client

Our client is an Australian online lighting retailer selling lighting, globes and ceiling fans from a range of leading brands.

The challenge

With tens of thousands of products, the retailer’s Shopping and Performance Max campaigns risked spreading budget across low-value items. The account needed to put spend behind the products and brands that drove profitable sales.

What we did

Cut low-value products

excluded products under $20 from Shopping and Performance Max, reviewed weekly, so budget went to items worth advertising.

Budget behind profit

moved budget into high-profit campaigns and scaled spend up and down with demand, including holiday periods.

Cleaner purchase tracking

consolidated revenue tracking onto a single purchase goal, so bidding optimised for real sales.

Feed and account health

fixed Merchant Center and policy issues quickly and refreshed Performance Max creative.

Brand and product reviews

launched dedicated campaigns for key lighting brands and ran proactive 45-day product reviews to find new winners.

The results


Performance comparison for April–September 2025 and April–September 2026
Measure Apr–Sep 2025 Apr–Sep 2026 Change
Ad spend $180,315 $160,088 -11%
Tracked revenue $862,515 $1,465,741 +70%
Tracked online orders 3,340 5,076 +52%
Return on ad spend 4.8x 9.2x +92%
Clicks 138,697 145,092 +5%

Why it worked

In large ecommerce accounts, the biggest gains often come from what you stop advertising. Removing low-value products and backing high-margin ranges meant every dollar went to products that actually sell.

What it means for the retailer

The retailer made about $600,000 more in tracked sales from Google Ads over six months, while spending $20,000 less.
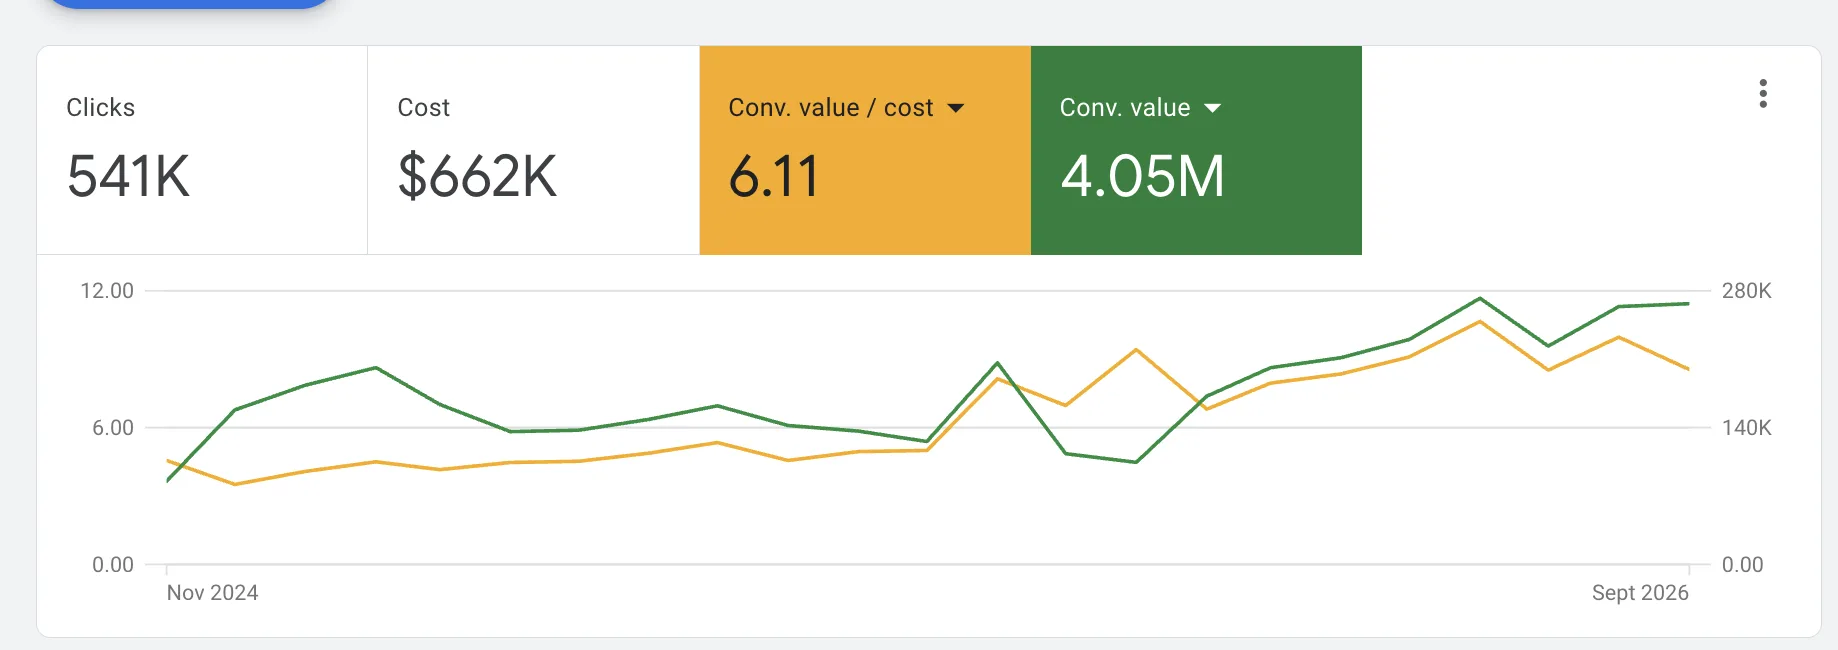

Monthly Revenue and Return on Ad Spend

Monthly tracked revenue

Monthly tracked revenue (green) and return on ad spend (yellow) in Google Ads, November 2024 to September 2026.


Want results like these?

You May Also Like

Check out How We Have Helped Our Clients

Google Reviews
★★★★★ 5.0
185+ 5-Star Reviews

Free SEO & Ads audit

See exactly what we'd fix no obligation.